Not All Eye Charts are the Same
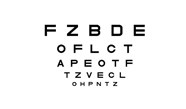
Herman Snellen was a Dutch ophthalmologist who devised an eye chart in 1862 to test a person’s visual acuity. This Snellen chart is still used today, in several versions. It consists of rows of letters which decrease in size but increase in number with each descending row.
A person standing 20 feet from the chart who can clearly read the sixth row down is said to have 20/20 vision. If a person standing 20 feet from the chart cannot read this line, but can read the line 3 rows higher, he/she is said to have 20/40 vision. These letters are twice as wide and twice as high as those on the 20/20 row. A person with 20/20 vision could read these letters standing 40 feet away.
But not all charts used to test visual acuity are the same. For more on the subject, today’s guest blogger is Joe Marino, President of M&S Technologies:
In the past it was difficult to determine the differences between the various chart projectors on the market such as Nikon, A&O, Cannon, Marco, Topcon, etc. Today, with the advent of Computerized Visual Acuity Systems, it’s easy to determine which systems incorporate exact science and follow the ANSI and ISO specification for vision testing. Simply look at the letter and line spacing, luminance levels, calibration settings and the lack of peer review and\or approvals from governing agencies. Unlike other less accurate and reduced quality systems who tout a new software release to allow the user to “select” correct spacing or those who proclaim “we’re certified because….we must be”, the Smart System® product line has withstood the test of time and review. These are not self-proclamations but rather peer-reviewed, published and accepted technologies that are approved by governing agencies such as the Food and Drug Administration and the National Eye Institute. With over 20,000 of our systems licensed world-wide, it’s time to take a close look at the Smart System 20/20.
Have a thought about this article? Contact Us and let us know.